The 12 Social Media KPIs That Matter in 2026 (With Formulas)
A KPI is a number with a decision attached. The twelve worth acting on across four groups, the formulas behind them, why industry benchmarks mislead, and a one-page monthly report format.
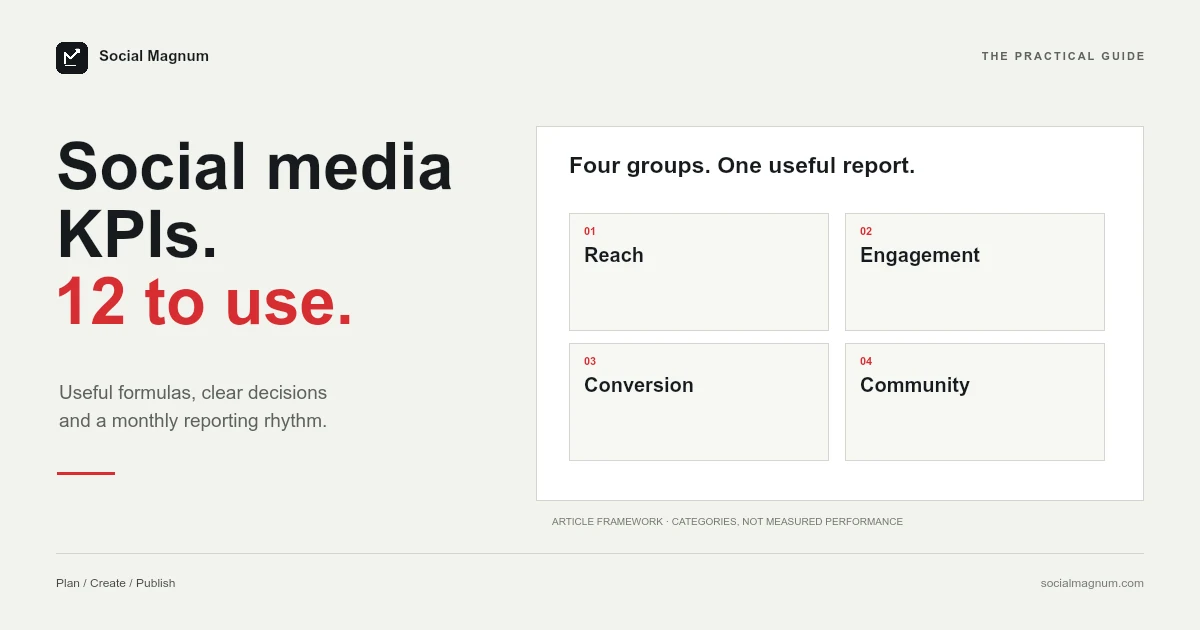
Social media produces more numbers than any other marketing channel and less clarity about which ones matter. The fix is picking few and picking on purpose: a KPI is a number tied to a goal with a decision attached — if it moves, you do something. This page is the working set of twelve, the formulas behind them, and a monthly report format that fits on one page.
Vanity metrics vs KPIs
The difference is the decision. Follower count is a fine number and a poor KPI — knowing it rarely changes what you do next week. Saves per post is a modest number and an excellent KPI — it tells you which content earns long-term interest, and next week’s calendar changes because of it. Likes, total impressions and follower milestones are worth glancing at; the twelve below are worth acting on.
The 12 KPIs, with formulas
| # | KPI | Formula | The decision it drives |
|---|---|---|---|
| 1 | Reach | Unique accounts that saw content | Is distribution growing or stalling? |
| 2 | Non-follower reach % | Non-follower reach ÷ total reach × 100 | Is content escaping the existing audience? |
| 3 | Follower growth rate | Net new followers ÷ starting followers × 100 | Trend over time, not the raw count |
| 4 | Engagement rate (by reach) | (Likes + comments + saves + shares) ÷ reach × 100 | Does the content land with those who see it? |
| 5 | Saves per post | Saves ÷ posts published | Which content earns lasting value |
| 6 | Shares per post | Shares or sends ÷ posts published | Which content recruits new audience |
| 7 | Comments per post | Comments ÷ posts published | Which content starts conversation |
| 8 | Video completion rate | Completed views ÷ video starts × 100 | Are hooks and length working? |
| 9 | Click-through rate | Link clicks ÷ impressions × 100 | Does content move people off-platform? |
| 10 | Conversions from social | Goal completions attributed to social | The number the channel is judged by |
| 11 | Response time | Median time to first reply (comments and DMs) | Is the community actually managed? |
| 12 | Posting consistency | Posts published ÷ posts planned × 100 | Is the plan being executed at all? |
Number 12 looks trivial and predicts the other eleven: when consistency slips under plan, every downstream metric follows it within weeks.
Reach: are new people seeing it?
Reach (1), non-follower reach (2) and follower growth rate (3) answer the top of the funnel. The one most teams miss is non-follower reach percentage — it is the closest thing to a virality dial, and the number our guides on going viral on Instagram and TikTok are really about moving.
Engagement: does it land?
Engagement rate by reach (4) is the fair version of the metric — rating content against the people who actually saw it. Beneath it, saves (5), shares (6), comments (7) and completion rate (8) tell you which kind of landing: saves mean useful, shares mean recruiting, comments mean conversation, completion means the hook and length are right. Two posts with identical engagement rates can need opposite follow-ups.
Conversion: does it pay?
CTR (9) and attributed conversions (10) connect the channel to the business. Be honest about attribution’s limits: last-click undercounts social’s assist role, so track the trend rather than worshipping the absolute number, and use UTM-tagged links everywhere links live.
Community: do you answer?
Response time (11) is the KPI teams skip because it measures them, not the content. It compounds quietly: fast first replies widen distribution on fresh posts and turn commenters into regulars. Auto-reply rules for the repetitive questions — a feature our inbox covers for comments and Instagram DMs — buy the humans time for the answers that need one.
Benchmarks, honestly
Industry benchmark tables are mostly unverifiable — samples unknown, definitions inconsistent, incentives obvious. The benchmark that changes decisions is your own trailing average: this month’s engagement rate against your last three months’, this quarter’s response time against last quarter’s. Beat yourself repeatedly and the absolute numbers take care of themselves.
The monthly report template
One page, five blocks, fifteen minutes to fill from your analytics screen:
- Headline: the three numbers that moved most (up or down), each with one sentence of why.
- The four groups: reach, engagement, conversion, community — this month vs trailing three-month average.
- Top three posts: what they were, which KPI each won, what to make more of.
- Flop worth learning from: one, with the honest lesson.
- Next month’s single focus: one KPI to move, and the content decision that should move it.
The short version
- 1
A KPI is a number with a decision attached; twelve is plenty, four groups keep them honest.
- 2
Engagement rate by reach, saves and shares beat likes for deciding what to make next.
- 3
Non-follower reach percentage is your growth dial; posting consistency predicts everything else.
- 4
Benchmark against your own trailing average — industry tables are mostly noise.
- 5
Report on one page, monthly, ending with a single KPI to move next.
Related reading: the fill-in strategy template (KPIs are its final section), the content calendar template and the best social media management tools.